Domestic Economic Updates
- Purchasing Managers’ Index (PMI) readings: India’s manufacturing sector activity grew at the fastest pace in 5 months as reflected in the HSBC India Manufacturing PMI reading. The index rose to 56.9 in February (revised upwards) from 56.5 in January driven by a rise in factory production and sales. Meanwhile, India’s services sector activity continued to expand although the momentum eased due to a slowdown in new orders and output. HSBC Services PMI came in at 60.6 in February (lower than the flash estimate of 62) compared to 61.8 in January.
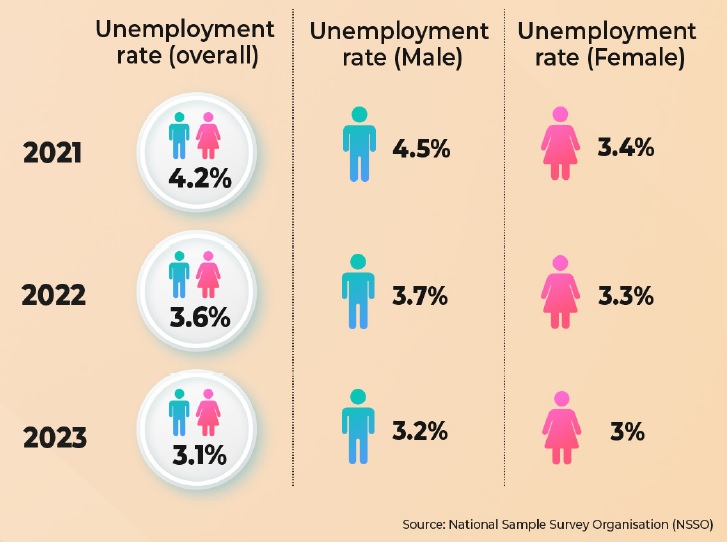
- India’s unemployment scenario has been improving since the COVID-19 pandemic driven by a pickup in economic activity after gradual unlocking. According to the report by National Sample Survey Organisation (NSSO), the unemployment rate for individuals aged 15 and above (defined as the percentage of unemployed individuals in the labour force) came down to 3.1% in 2023 from 3.6% in 2022. Similar positive trend has been witnessed in unemployment among males and females.
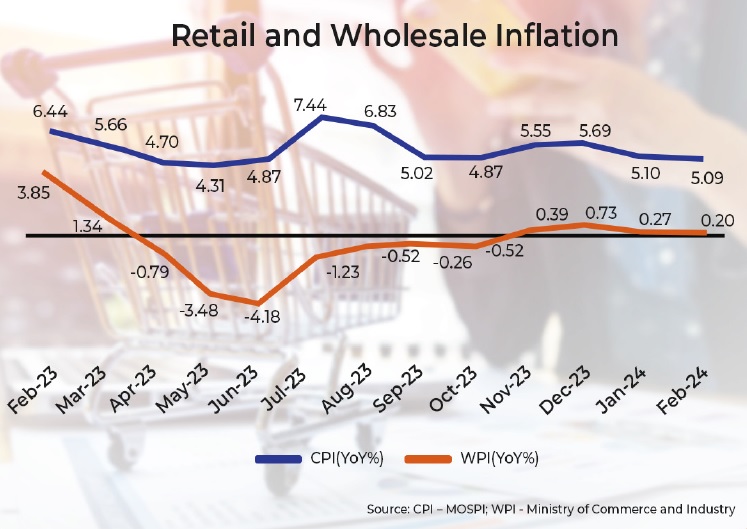
- India’s consumer price/retail inflation (CPI) went down marginally to 5.09% YoY in February from 5.1% YoY in January thereby easing to a 4-month low and remaining within the RBI’s tolerance band of 2-6%. The headline inflation kept steady on a sequential basis due to a rise in prices of certain food items (like cereals and fish) offset by a decline in prices of other food items (like spices, eggs, and edible oil). Overall food inflation rose to 8.66% in February from 8.3% in January. The vegetable inflation increased to 30.25% in February from 27.03% in January. The fuel and light inflation declined further to -0.77% in February from -0.60% in January.
- India’s wholesale price inflation (WPI) eased to a 4-month low of 0.20% YoY in February from 0.27% in January coming in below the consensus estimates of 0.25%. The moderation in WPI is attributed to a sharp fall in prices of manufactured products (-1.27% vs. -1.13% in January) and power (-1.59% vs. -0.51% in January). Food inflation rose to 4.09% YoY in February from 3.79% in January while prices of primary articles (food particles, minerals, and vegetables) went up 4.49% YoY vs. 3.84% in January.
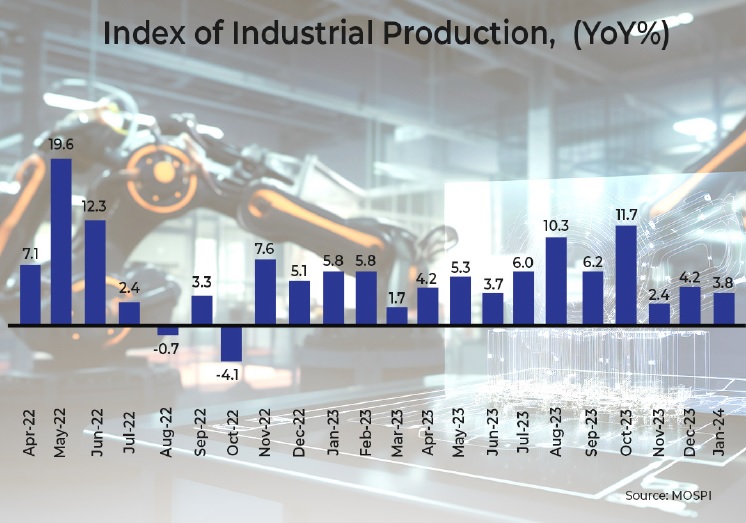
- India’s industrial output, as depicted by the Index of Industrial Production (IIP), increased by 3.8% YoY in January 2024, decelerating from 4.2% YoY in December 2023 (revised from 3.8%). The slowdown is caused by the declaration in the growth of manufacturing output (which accounts for over 77% of the overall industrial output) to 3.2% in January from 4.5% in December 2023. This more than offset the growth in mining and electricity production (5.9% and 5.6% vs. 5.2% and 1.2%, respectively in December 2023).
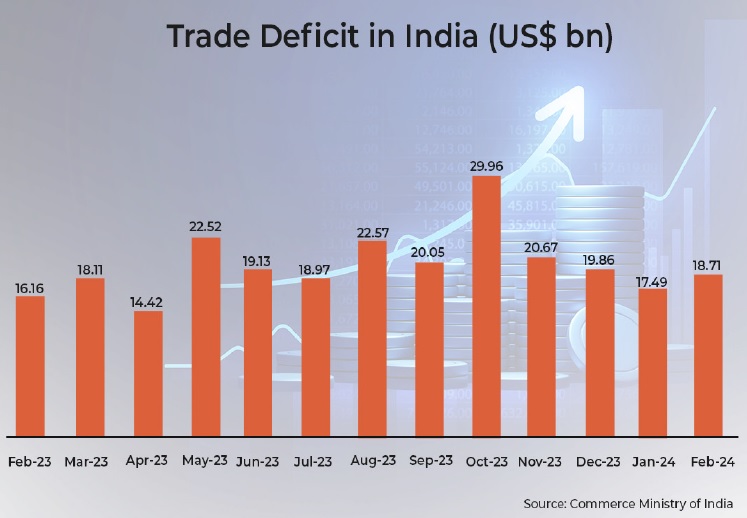
- India’s merchandise trade deficit widened to US$18.71 billion in February from US$17.49 billion in January. This happened as imports rose 12.2% YoY at US$60.1 billion while exports increased 11.9% YoY to US$41.4 billion, led by higher shipments of engineering goods, electronic items, and pharma products. Total exports are the highest in the current fiscal year. Gold imports during the month surged ~134% to US$6.15 billion.
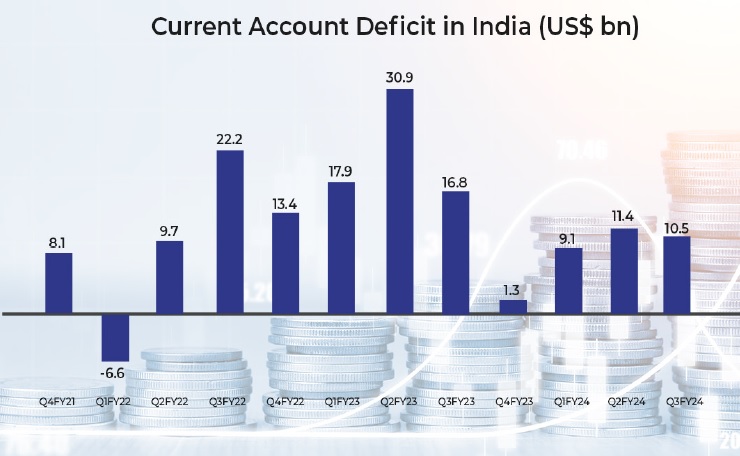
- India’s current account deficit (CAD), which is the excess of imports of goods and services over exports of goods and services, narrowed both MoM and YoY bases in the third quarter of FY24 ended December 2023. The CAD reduced to US$10.5 billion or 1.2% of GDP in Q3FY24 from US$11.4 billion or 1.3% of GDP in the September quarter/Q2FY24 and US$16.8 billion or 2% of GDP in Q3FY23. The decline is attributed to higher net services exports (driven by software, business, and travel services) at US$45 billion and remittances at US$29 billion (see chart).
Growth forecasts
- Global rating agency Moody’s upgraded India’s CY2024 GDP growth forecast from 6.1% earlier to 6.8% based on “stronger-than-expected” economic data and mentioned that the country will remain the fastest growing among G20 nations. In Oct-Dec 2023, India’s economy grew 8.4% surpassing analysts’ expectations of 6.6%, which Moody’s attributed to the government’s capital spending and vigorous manufacturing activity.
- Fitch Ratings revised the GDP growth forecast for India upwards by 0.5 percentage points (ppt) to 7% in FY25, expecting strong expansion in the economy to continue. The rating agency believes domestic demand, particularly investment, will be the main catalyst of growth in the country, supported by sustained levels of business and consumer confidence. The agency also raised the global growth forecast by 0.3 ppt to 2.4% for 2024. The growth forecast for the US has been upgraded to 2.1% from 1.2% for the year. However, the forecast for China has been trimmed to 4.5% from 4.6% for 2024 due to a weaker outlook on the real estate market and rising evidence of deflationary pressures.
- The US-based market intelligence and credit rating provider S&P Global raised India’s GDP growth forecast by 0.4 percentage points to 6.8% for FY25 on the back of robust domestic demand and recovery in exports. However, the forecast is lower than the Centre’s official estimate of 7.6%. It also expects the Reserve Bank of India (RBI) to cut repo rate by 75 basis points in FY25 as consumer inflation is expected to decline further.
Global Economic Updates
Central bank policy actions
- The US Federal Reserve kept the federal funds rate steady at a 23-year high of 5.25%-5.5% for a 5th consecutive time, which is in line with market expectations. However, most members of the Federal Open Market Committee (FOMC) are still projecting three rate cuts later in 2024, according to the Fed’s Summary of Economic Conditions. The US policymakers revealed that while inflation is coming down, it “does not expect it will be appropriate” to cut rates until the bank is confident about inflation moving towards its 2% target.
- The Bank of Japan (BOJ) officially ended its negative interest rate policy by increasing its key interest rates for the first time in 17 years from -0.1% to a range of 0- 0.1%. Economists believe the next rate hike might occur in the second half of 2025. In 2016, Japan cut the interest rate below zero in order to stimulate the country’s stagnating economy and encourage people to spend their money rather than depositing in a bank. BOJ also announced that it would abandon its yield curve control (YCC) policy, also introduced in 2016, which saw it buying Japanese government bonds to control interest rates. BOJ Governor Kazuo Ueda stated that the decision to end negative interest rates is the wage arbitration that is currently taking place between employers and unions and major corporations hiking wages for their workers.
- The Reserve Bank of Australia (RBA) decided to keep the cash rate target unchanged at 4.35% and the interest rate paid on Exchange Settlement balances steady at 4.25%. The RBA noted that inflation continues to moderate, in line with its recent forecasts driven by moderating goods inflation. However, services inflation remains elevated and has been moderating at a more gradual pace. Despite encouraging signs of moderating inflation, RBA is of the view that the economic outlook remains uncertain.
- People’s Bank of China left its 1-year loan prime rate (LPR) steady at 3.45%, while the 5-year LPR was kept unchanged at 3.95%. This is in line with market expectations after the central bank kept its key policy rate steady last week. China has forecasted an economic growth target of ~5% for 2024 while it needs to revive its struggling property sector. Most new and outstanding loans in China are based on the 1-year LPR, while the 5-year rate influences the pricing of mortgages.
- China’s central bank left a key policy rate unchanged at 2.5% for its 387-billion-yuan (US$54 billion) worth of one-year medium-term lending facility (MLF) loans to some financial institutions. The status quo was in line with expectations. With 481-billion-yuan (US$67 billion) worth of MLF loans set to expire this month, the operation resulted in a net 94-billion-yuan (US$13 billion) fund withdrawal from the banking system.
- The Bank of Canada (BoC) kept its key overnight rate at 5% as part of its continued efforts to bring inflation down to its target level of 2%. In January 2024, inflation dipped to 2.9% but remained above the target level. BoC hiked the rate to 5% in July 2023, marking the first time since April 2001 that the rate had hit the 5% mark.
Inflation readings
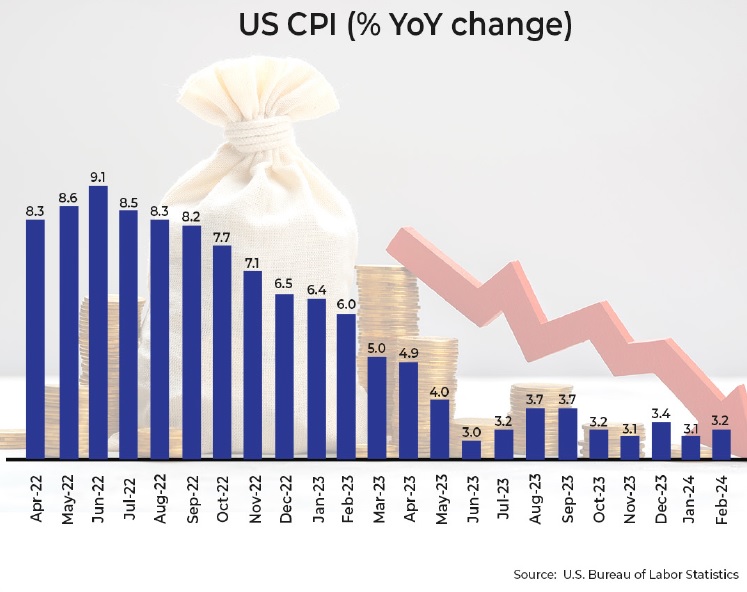
- Consumer price inflation in the US edged up to 3.2% YoY in February from 3.1% YoY in January and came in above the consensus estimates of 3.1%. The rise is attributed to a rise in shelter and gasoline price indices, which contributes over 60% to the monthly rise in the overall index. Although the inflation is off the mid-2022 peak, it is still above the Fed’s target level of 2%.
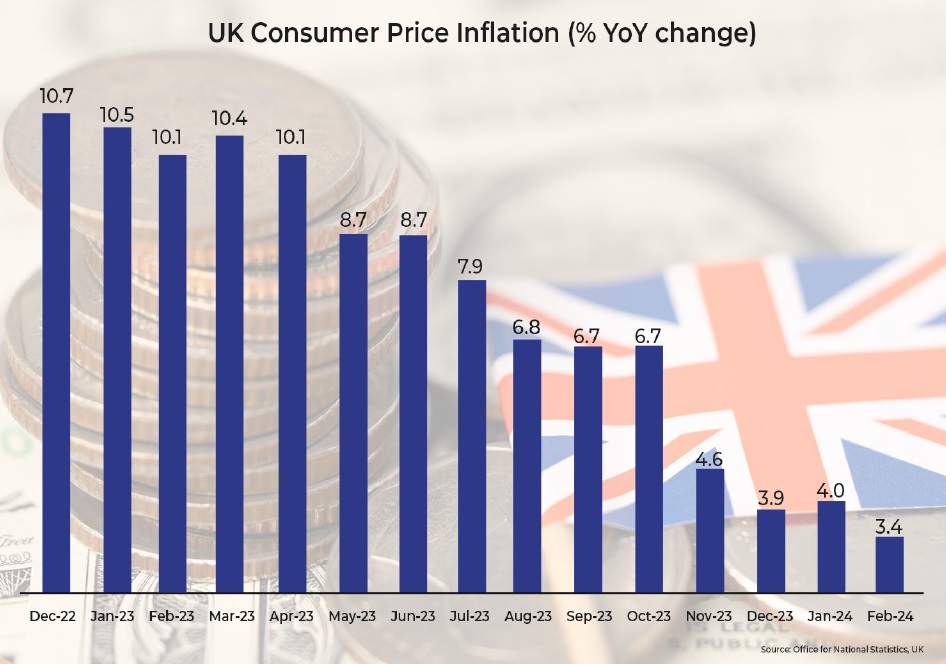
- Consumer price inflation in the UK dropped to the lowest level since September 2021 at 3.4% in February from 4% in January. The softness is attributed to a slowdown in prices of food and restaurants. However, the inflation is still above the Bank of England’s target of 2% fuelling the speculation that the central bank might hold on to the interest rates at the same level in the next meeting.
- Consumer price inflation in the Euro zone declined to 2.6% YoY in February from 2.8% in January. However, it remained above the consensus estimates of 2.5%. The decline is attributable to a fall in food and drink costs (rose 4% in February vs. 5.6% in January) and energy prices (fell 3.7% in February). Core inflation, which excludes volatile energy, food, alcohol, and tobacco prices, declined to 3.1% in February from 3.3% in January.
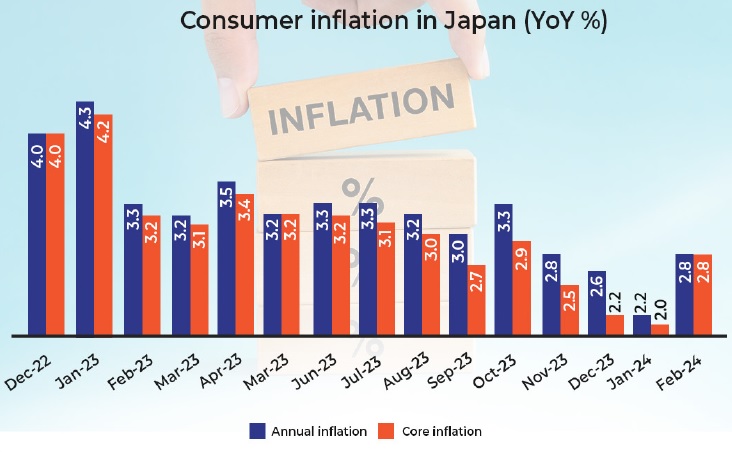
- The annual inflation in Japan rose to 2.8% in February from 2.2% in January, hitting the highest level since last December 2023. The inflation accelerated as energy subsidies introduced by the government in February 2023 started losing their effect. The core inflation surged to a 4-month high of 2.8% from 2% in January and came in above the central bank’s target of 2% for 23 straight months.
Other economic indicators
- PMI readings: The ISM Manufacturing PMI in the US declined to 47.8 in February from 49.1 in January and came in below the consensus estimates of 49.5. The further contraction in the manufacturing activity is attributed to declines in the new orders index from 52.5 in January to 49.2 in February and the production index from 50.4 to 48.4, the lowest level since July 2023. The ISM Services PMI in the US declined to 52.6 in February from 53.4 in January depicting continued expansion in the sector for the 14th consecutive month. The S&P Global UK Manufacturing PMI rose to 47.5 in February (revised upwards) from 47 in January. Despite the rise, PMI data indicated a contraction in the manufacturing sector for the 19th consecutive month due to disruptions in production and vendor delivery schedules led by the crisis in the Red Sea. The Caixin China General Service PMI declined further for the second straight month to 52.5 in February from 52.7 in January and 52.9 in December 2023. Despite being in the expansionary zone for the 14th straight month, the subsequent decline in the index is led by a subdued rise in new orders compared to the average recorded in 2023. The au Jibun Bank Japan Services PMI rose to 52.9 (revised higher from 52.5) in February from January’s 4-month peak of 51.5 driven by domestic demand in the sector. It marks the 18th straight month of expansion in the sector (above the 50 threshold) driven by an uptick in new businesses amid tourism demand and product launches. The J.P. Morgan Global Composite Output Index rose to 52.1 in February from 49.7 in January indicating a transition from contraction to expansion in global economic activity and new orders. The recovery is led by the services sector and the first expansion of manufacturing output since July 2023.
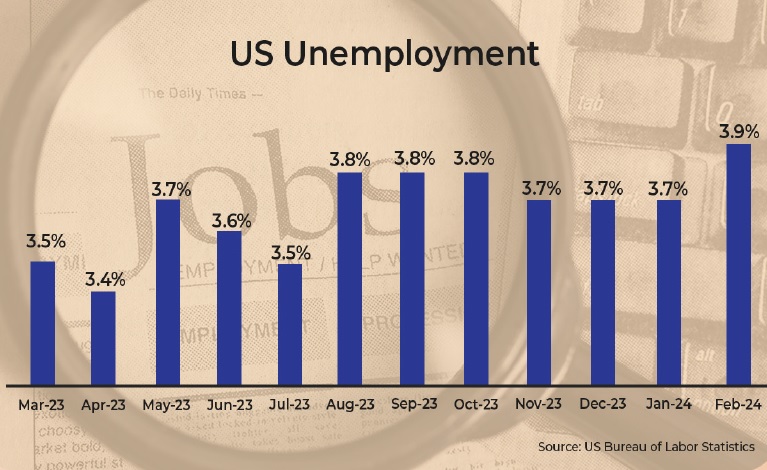
- The unemployment rate in the US inched up to 3.9% in February from 3.7% in January. The February rate was the highest since January 2022 and exceeded market expectations of 3.7%. The labor force participation rate was 62.5% in February for the third consecutive month.
Disclaimer:
The details mentioned above are for information purposes only. The information provided is the basis of our understanding of the applicable laws and is not legal, tax, financial advice, or opinion and the same subject to change from time to time without intimation to the reader. The reader should independently seek advice from their lawyers/tax advisors in this regard. All liability with respect to actions taken or not taken based on the contents of this site are hereby expressly disclaimed.


