Domestic Economic Updates
- The Reserve Bank of India in the first Monetary Policy Committee (MPC) meeting of FY2024-25 kept the repo rate unchanged at 6.5%. It was the 7th consecutive time the key policy rate has been kept at the same level. The 6-member committee also maintained the policy stance at ‘withdrawal of accommodation’. FY25 GDP growth forecast has been kept unchanged at 7% while the inflation forecast based on the consumer price index (CPI) has remained unchanged at 4.5% for the fiscal year.
- The Centre’s GST collection in March became the second highest in FY24 at INR 1.8 lakh crore despite the adverse impact of a weaker integrated GST (IGST) on imports of goods. With this, GST collection for the full fiscal year stood at INR 20.2 lakh crore, depicting a YoY growth of 11.7%. Domestic transactions contributed the most to GST collection in March as gross receipts from such transactions grew by 17.6%.

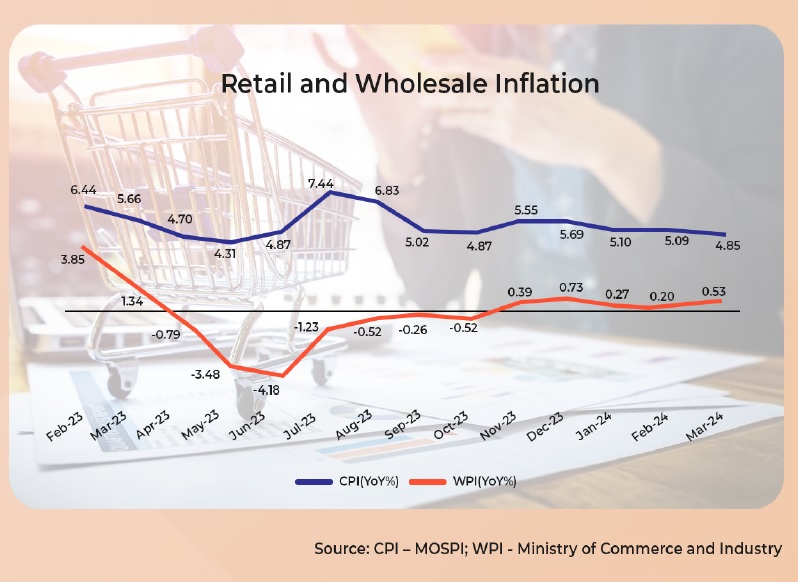
- India’s retail inflation based on the Consumer Price Index (CPI) eased to a 10-month low of 4.85% in March from 5.09% in February. The inflation was broadly in line with expectations and remained within the Reserve Bank of India’s (RBI) medium-term tolerance band of 2-6%. The decline in inflation can be attributed to a fall in inflation in categories like food (8.52% in March vs 8.66% in February), fuel and light (-3.24% vs -0.77%), and housing (2.77% vs 2.88%). The wholesale inflation accelerated to a 3-month high of 0.53% in March from 0.2% in February driven by primary articles (food and non-food items like oil seeds, minerals, and crude), fuel and power, and manufactured products. The annual rate of inflation for primary articles rose to 4.51% in March from 4.49% in February; fuel and power increased to -0.77% in March from -1.59% in February; manufactured products rose to -0.85% in March from -1.27% in February.

- The growth in India’s Index of Industrial production reached a 4-month high of 5.7% in February from 3.8% in January driven by a broad-based rise in mining, manufacturing, and electricity output. Following are the growth in index components:


- India’s merchandise trade deficit narrowed to US$15.6 billion in March from US$18.71 billion in February, and US$16.02 billion in January. It is the lowest deficit in 11 months. The previous low was US$14.44 billion in April 2023. India’s goods exports slipped 0.7% YoY to US$41.7 billion in March, led by lower oil exports even though non-oil exports remain strong. On the other hand, goods imports declined 6% YoY to US$57.3 billion, due to lower gold imports. Meanwhile, net services exports declined 6.2% YoY to US$12.7 billion
- India’s net direct tax collections rose ~18% YoY to INR 19.58 lakh crore in FY24. It surpassed the annual budget estimates by INR 1.35 lakh crore and the revised estimates by INR 13,000 crore. This will aid the fiscal deficit target achievement for the fiscal year, which is 5.8% (lowered from 5.9% earlier).
- India’s net foreign direct investment (FDI) plunged 45.5% YoY in the first 11 months of FY24 (April 2023 to February 2024) to US$14.6 billion. Repatriation/disinvestment by those who made direct investments in India rose ~41% to US$38.3 billion in the period from US$27.2 billion in the same period a year ago.
Growth forecasts
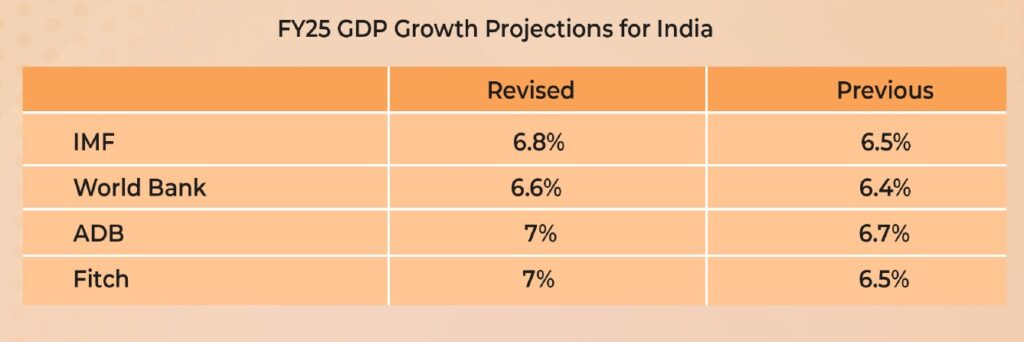
- The World Bank has revised its FY24 GDP growth projection for the Indian economy from 6.3% to 7.5% due to robust growth in the December 2023 quarter. However, the global agency’s growth projection for FY25 has been moderate as it raised the estimate by 20 basis points to 6.6%. It expects a slowdown in growth between FY24 and FY25 due to a “deceleration in investment from its elevated pace in the previous year”.
- The Asian Development Bank has revised India’s GDP growth forecast for FY25 to 7% from the earlier projection of 6.7%, stating that the growth will be driven by strong public and private sector investment demand as well as gradual improvement in consumer demand. However, the projection is lower than the 7.6% it had earlier projected for FY23. For FY26, ADB has projected India’s growth at 7.2%.
- The International Monetary Fund (IMF) revised India’s FY25 GDP growth projection upwards by 30 basis points (bps) to 6.8% due to buoyant domestic demand and rising working-age population. However, the estimate is below the 7% growth estimate for FY25 by RBI. In its January report, the IMF raised India’s GDP growth forecast for FY24 by 110 bps to 7.8%, which is higher than the estimate of 7.6% by the National Statistical Office. For FY26, the IMF expects the growth to slow down slightly to 6.5%.

Global Economic Updates
Central bank policy actions
- The European Central Bank (ECB) kept its interest rates unchanged at record-high levels of 4.5% for a 5th consecutive time. The deposit facility rate is kept unchanged at 4%, which is the highest level since the introduction of the single currency in 1999. The refinancing and marginal lending facility rates are fixed at 4.50% and 4.75%, respectively.
- The People’s Bank of China kept the key rates unchanged —the 1-year loan prime rate (LPR) at 3.45% and the 5-year LPR at 3.95% — following a record reduction of 25 basis points (bps) in February. This happened after the GDP growth in the country came in at 5.3% YoY in the first quarter significantly beating market expectations.
- The Bank of Japan kept its short-term interest rate unchanged at around 0% to 0.1%, as widely expected. This happened after the central bank announced its first rate hike since 2007 in March. The status quo indicates that inflation is on track to durably hit its target of 2% in coming years.
- The Central Bank of Indonesia raised the 7-day reverse repurchase rate by 25 bps to 6.25% in a surprise move which is explained by the Governor as an “anticipatory, forward-looking, and pre-emptive” policy response to the rise in global crude oil prices and the depreciation in Indonesian rupiah. It is the highest rate since the bank made the instrument its main policy rate in 2016.
Inflation readings
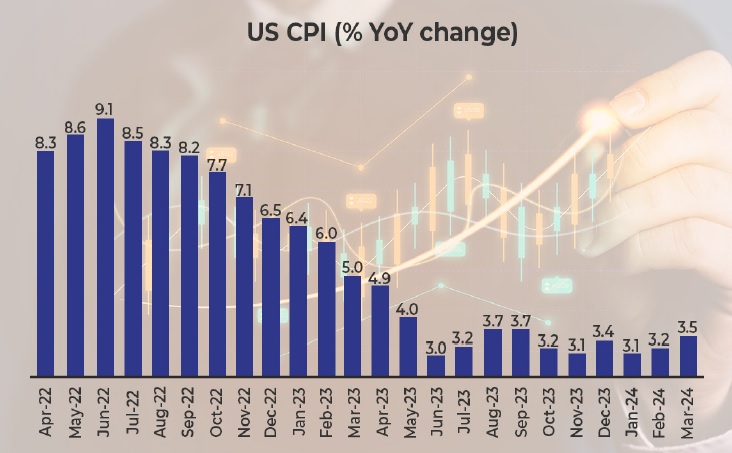
- Consumer price inflation in the US accelerated for a second straight month to the highest level since September at 3.5% YoY in March. This was compared to 3.2% in February and a consensus of 3.4%. Producer prices in the US rose 2.1% YoY, which is the highest in 11 months.

- Consumer price inflation in the UK declined to its lowest level in two and a half years at 3.2% in March from 3.4% in February due to the softening of food prices. However, the inflation was below the consensus estimates of 3.1% and remained above the Bank of England’s target of 2%. However, given the direction of movement, economists believe inflation is likely to fall further in April.
- Consumer price inflation in the Euro Area slipped to a 4-month low of 2.4% in March from 2.6% in February but still exceeded the European Central Bank’s target of 2%. Inflation for food, alcohol, and tobacco went down in March compared to February.
- Consumer price inflation in Japan declined to 2.7% in March from February’s 3-month peak of 2.8% and met the consensus estimates. Prices reduced in categories like transport (2.9% in March vs 3% in February), clothes (2% vs 2.6%), furniture & household utensils (3.2% vs 5.1%), healthcare (1.5% vs 1.8%), communication (0.2% vs 1.4%), and culture & recreation (7.2% vs 7.3%).
- Consumer price inflation in China decelerated to 0.1% YoY in March compared to 0.7% in February and consensus estimates of 0.4%. The deceleration is attributed to a seasonal decrease in demand for food and travel services after the Spring Festival holidays. Meanwhile, producer prices in the country declined 2.8% YoY in March compared to 2.7% in February. It is in line with consensus estimates.
Other economic indicators
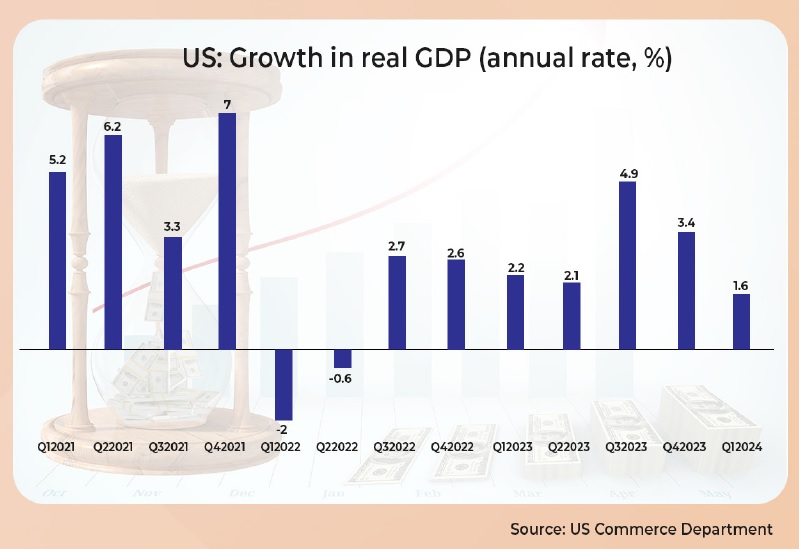
- The US economy started 2024 with a slower quarterly growth due to a decline in private inventory, a rise in imports, and sluggish growth in private consumption at 2.5% compared with a 3.3% growth in Q42023. Fixed investment and government spending at the state and local level remained solid contributing positively to the GDP growth. The Q12024 annualised growth of 1.6%, when adjusted for seasonality and inflation, is lower than the consensus estimates of 2.4%

- Purchasing Managers’ Index (PMI) readings: The manufacturing PMI reading for March by the Institute for Supply Management (ISM) for the US indicated a rebound in the sector after one and half years (since September 2022) due to a sharp pick up in production and new orders. It increased to 50.3 (above 50 indicates expansion) in March 2023 from 47.8 (below 50 indicates contraction) in February and surpassed the consensus estimates of 48.4. The HCOB Eurozone Manufacturing PMI came in at 46.1 in March 2024 versus 46.5 in February. The March reading is a 3-month low due to changes in suppliers’ delivery times and stocks of purchases. The Caixin General Manufacturing PMI for China increased to 51.1 in March from 50.9 in February driven by higher output and a rise in input purchases by Chinese manufacturers. The au Jibun Bank Japan Manufacturing PMI came in at 48.2 in March 2024 versus 47.2 in February. It was the 10th straight month of contraction in factory activity, but the softest contraction since November 2023, amid a lower reduction in output and new orders. The HSBC India Manufacturing PMI jumped to a 16-year high at 59.1 in March from 56.9 in February. This happened as India’s manufacturing output grew for the 33rd consecutive month driven by the momentum in consumer, intermediate, and investment goods sectors. The J.P. Morgan Global Manufacturing PMI increased marginally to 50.6 in March from 50.3 in February, making its highest reading since July 2022. This happened due to an acceleration in manufacturing output growth in the US and China while India led the rankings. There are some improvements in Euro zone despite being an overall lag. JP Morgan noted a steep downturn in Germany and Austria, further contraction in France, and a fresh decline in Ireland.
- Services PMI: The ISM Services PMI in the US declined to 51.4 in March from 52.6 in February and came in below the consensus estimate of 52.7. The decline is led by sluggish growth in new orders and a contraction in employment. The S&P Global UK Services PMI slipped to 53.1 in March from 53.8 in February. Despite the moderation, the expansion continued with resilient business and consumer spending reported by companies. The au Jibun Bank Japan Services PMI revised lower to a 7-month high of 54.1 in March versus 52.9 in February, indicating a 19th straight month of expansion in the service sector, led by higher demand and growing customer base.
- Retail sales in the US increased more than expected by 0.7% MoM in March compared to a forecast of 0.3%. Sales growth in February has been revised upwards from 0.6% to 0.9% MoM. The sales growth is driven by a strong rise in receipts at online retailers.
- Industrial production in the Euro Area and the European Union fell 6.4% and 5.4% YoY in February. In Euro zone, it extended the 6.6% contraction in January. Among the EU member states, the highest monthly gain in industrial output was recorded in Ireland (3.8%), Hungary (3.5%), and Slovenia (3.3%) whereas the largest declines were observed in Croatia (4.6%), Lithuania (3%), and Belgium (2.7%).
- The Chinese economy grew better than expected in the first quarter of CY2024 at 5.3%, higher than the consensus estimates of 4.6%. The growth is attributed to improvements in high-tech manufacturing. It also marked an acceleration in growth from 5.2% in the previous quarter.
Disclaimer:
The details mentioned above are for information purposes only. The information provided is the basis of our understanding of the applicable laws and is not legal, tax, financial advice, or opinion and the same subject to change from time to time without intimation to the reader. The reader should independently seek advice from their lawyers/tax advisors in this regard. All liability with respect to actions taken or not taken based on the contents of this site are hereby expressly disclaimed.


