Executive Summary
The month started quite volatile with weaker global financial sentiments spooking markets as yields plunged, and stocks tanked. However, fears of a hard landing in the US have so far proven to be unfounded, and the asset markets regained stability through the month with a stronger set of data points (GDP, retail sales, etc). Markets perceived Fed Chair Powell’s comments at Jackson Hole as dovish and were quick to price in imminent rate cuts beginning September. While markets are pricing aggressive rate cuts, the Fed might choose to go slow and steady with rate cuts, ensuring data points throughout the year support sustained rate cuts.
Back at home, global volatility spilled onto domestic markets, however, it was short-lived. On the policy front, RBI kept rates on hold and indicated continued progress on inflation without hurting growth, as evident from their forecasts. On the data front, CPI came in softer, while PMIs continued to hold up. Headline GDP though softer, GVA growth surprised to the upside vs consensus expectations, led by the services sector. Private consumption showed signs of recovery after a lacklustre FY24.
Many factors that could have kept risk aversion elevated have failed to do so. Tensions in the Middle East escalated but their impact on energy prices was limited. Concerns around China’s slowdown persist, but pressure on Chinese currency eased this month on the back of a broader weakening in USD.
Domestic Updates
India’s retail inflation dips below RBI target for first time in ~5 years
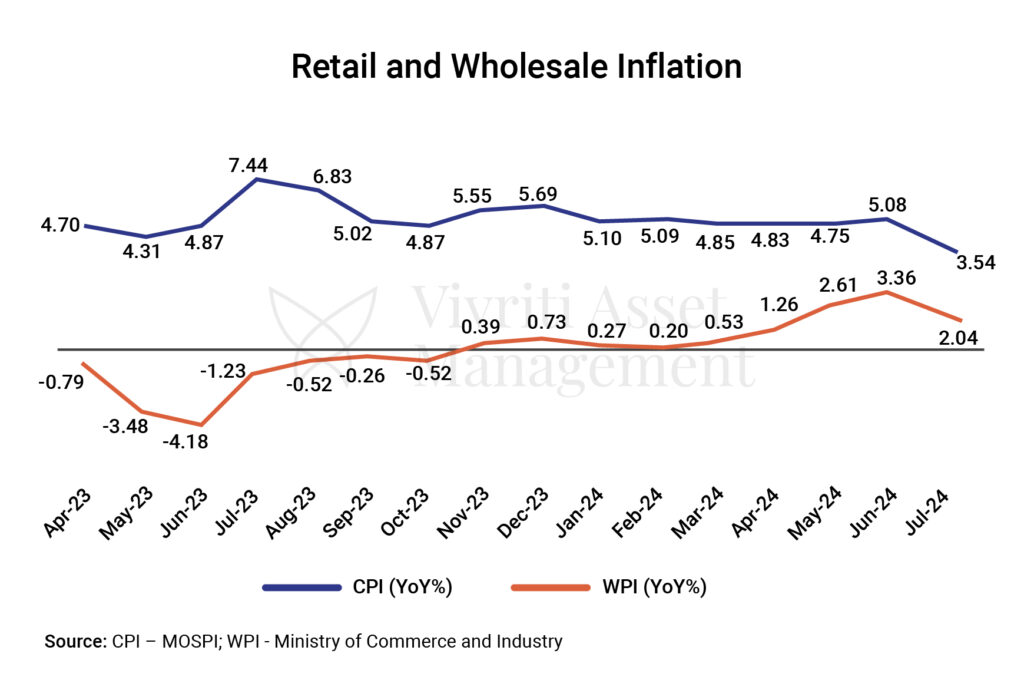
The retail inflation in India, which is measured as a change in the Consumer Price Index (CPI) softened to 3.54% YoY in July from 5.08% in June and 7.44% in July 2023. It’s the lowest reading in the last 59 months. It’s the first time in nearly 5 years that retail inflation came in below the RBI’s medium-term target of 4%. This is attributable to the food inflation that reached its lowest level since June 2023 as well as the high base effect of last year.
Wholesale price inflation decelerates for first time in 3 months
Inflation based on the wholesale price index (WPI) declined to 2.04% YoY in July from 3.36% in June coming in below market forecasts of a 2.39% rise. This happened as Primary Articles (food particles, minerals, and vegetables) and Food Index rose at a softer pace in July vs. June (3.08% vs 8.80% and 3.55% vs 8.68%, respectively) while vegetable (-8.93% vs 38.76%) and paddy (10.98% vs 12.07%) inflation fell.
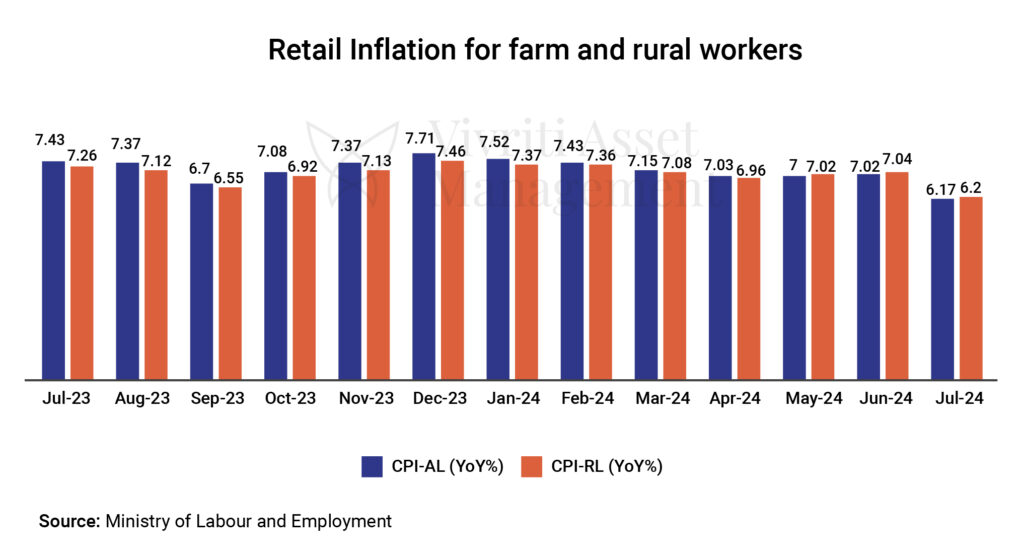
Retail inflation for farm and rural workers softens
Retail inflation for farm and rural workers softened to 6.17% YoY and 6.20% in July 2024, respectively, from 7.02% and 7.04%, respectively due to lower prices of certain food items.
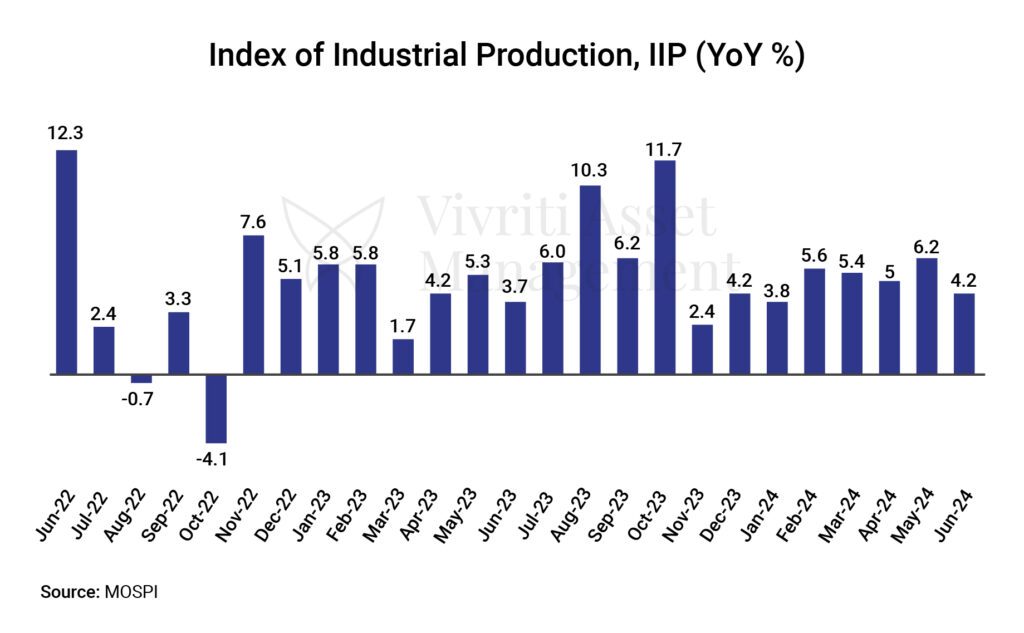
India’s industrial output growth moderates
The growth in India’s industrial output, as measured by the Index of Industrial Production (IIP), moderated to 4.2% in June from 6.2% in May due to sluggish growth in manufacturing and electricity output. The growth in manufacturing output decelerated to a 7-month low of 2.6% in June from 5% in May while the same in electricity slowed to a 3-month low of 8.6% from 13.7% in May. However, the growth in mining output rose to an 8-month high of 10.3% in June from 6.6% in May.
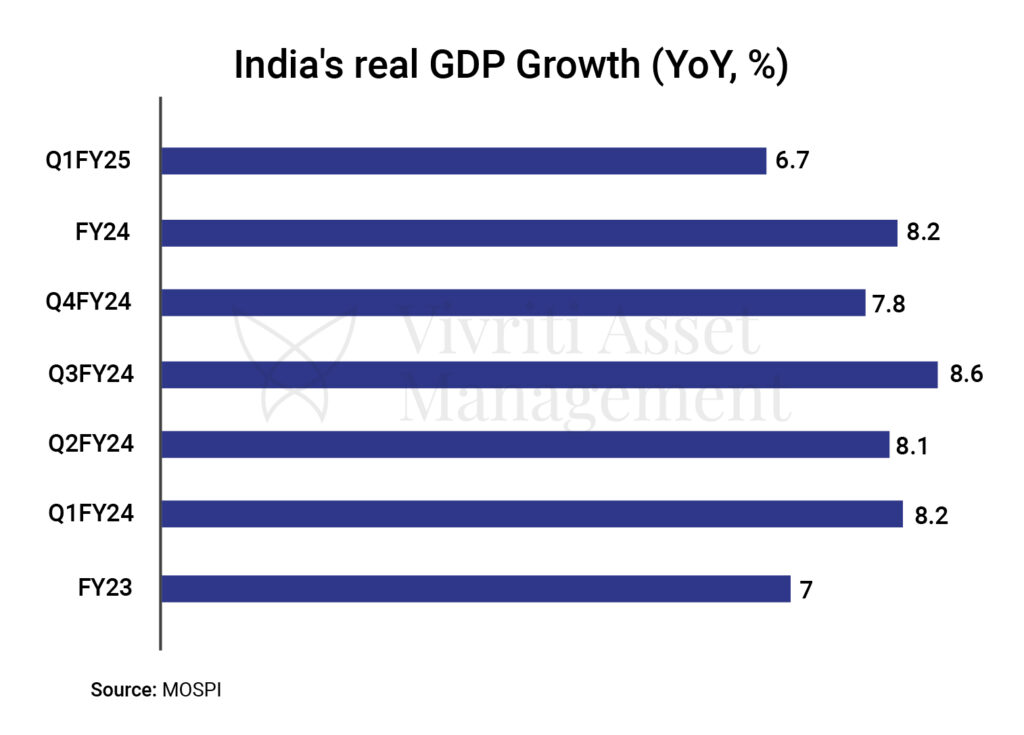
India’s real GDP growth slips to 15-month low
The growth in India’s real GDP slipped to a 15-month low in the first quarter of FY25 at 6.7% YoY compared with 7.8% in the previous quarter. Despite the fall, India still remains the world’s fastest major economy (China’s GDP growth in the April-June quarter is recorded at 4.7%). The slowdown in India’s real GDP growth has been attributed to lower-than-expected consumer spending (although consumer demand remained strong growing 7.44% YoY in Q1FY25 compared with 4% in Q4FY24) and subdued government spending (declined 0.24% YoY) as well as election-related disruptions and extreme heat due to summer impacting economic activities.
The primary sector (comprising agriculture, livestock, forestry, fishing, and mining & quarrying) witnessed a degrowth of 2.7% YoY against a growth of 4.2% in the same quarter of FY24. The secondary sector (comprising manufacturing, electricity, gas, water supply & other utility services, and construction) depicted a YoY growth of 8.4% compared with 5.9% in the year-ago quarter. The tertiary sector (services) growth declined to 7.2% YoY compared with 10.7% in Q1FY24.
Despite a slowdown in India’s GDP growth, growth in Gross Value Added (GVA) surprisingly accelerated to 6.8% in Q1FY25 from 6.3% in Q1FY24 and was higher than expected. This was mainly led by construction, public administration, defence and other services, and agriculture segments.
Fiscal deficit stands at 8.1% of FY estimates
India’s fiscal deficit, the gap between govt. expenditure and revenue, came in at INR 1.36 lakh crore for the first quarter of FY25, which is 8.1% of the full-year estimate of INR 16.85 lakh crore, set in the interim budget. However, the govt. reduced the fiscal deficit projection for FY25 to INR 16.13 lakh crore in the annual budget presented in July.
“We are seeing good amount of convergence between market expectations and RBI policies”, Shaktikanta Das
The Reserve Bank of India’s Monetary Policy Committee (MPC) keeps the repo rate unchanged at 6.5% for the 9th time in a row at its bi-monthly meeting with a majority of 4:2. The committee also retained the stance of ‘withdrawal of accommodation’. Governor Shaktikanta Das said, “We are seeing a good amount of convergence between market expectations and RBI policies, they are well aligned.” The central bank retained the inflation forecast at 4.5% raising concerns about food price trajectory and geopolitical tensions. Quarterly forecasts of inflation are revised as follows:
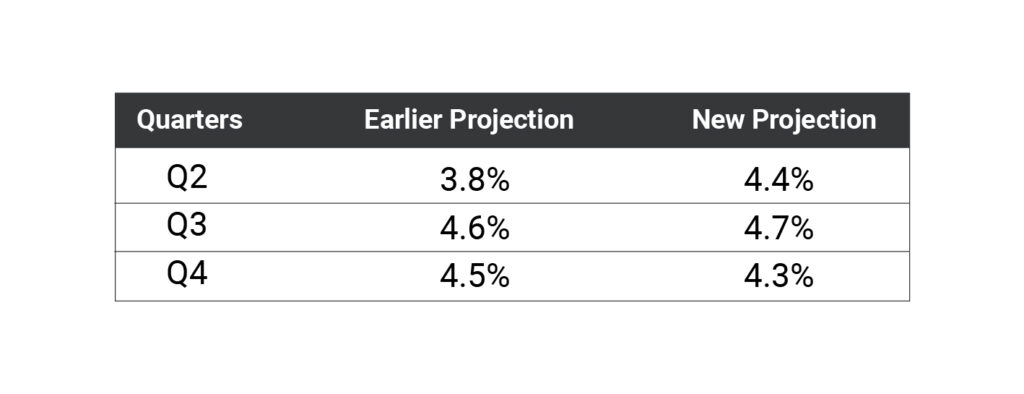
The GDP growth projection was kept unchanged for FY25 (at 7.2%) as well as for Q2FY25, Q3FY25 and Q4FY25. However, the GDP growth forecast for Q1FY25 has been lowered from 7.3% to 7.1%.
India is on fast track in terms of FDI inflows in manufacturing
The foreign direct investment (FDI) inflows in the manufacturing sector jumped 69% to US$165.1 billion in the last 10 years (2014-24), revealed Jitin Prasada, the Minister of State for Commerce and Industry. In Apr-Jun 2024, FDI to India rose by 26.4% to US$22.4 billion, marking the fastest expansion in nearly 5 quarters.
India’s trade deficit continues to expand
India’s trade deficit continues to expand due to declining exports and rising imports. In July 2024, it stood at US$23.5 billion compared with US$20.98 billion in June. Merchandise exports fell 1.4% YoY to US$33.98 billion while merchandise imports increased 7.5% YoY to US$57.48 billion in July.
Unemployment rate declines from 8-month high
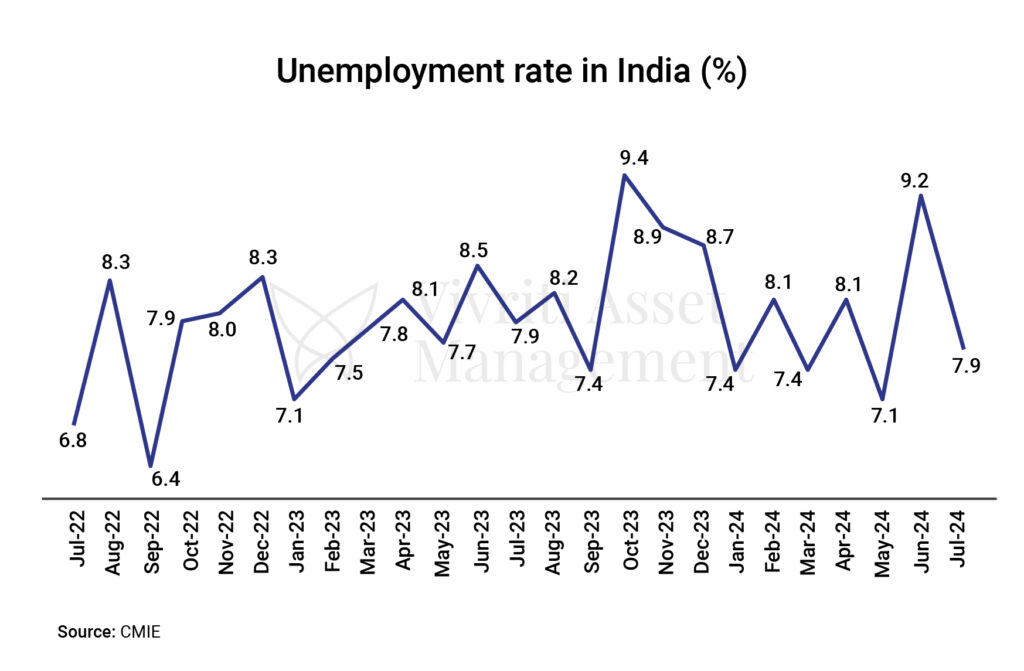
The unemployment rate in India dipped to 7.9% in July from the 8-month high of 9.2% in June, revealed the Centre for Monitoring Indian Economy (CMIE) based on their Consumer Pyramids Household Survey. In July, unemployment was higher in urban areas at 8.5% compared to rural areas at 7.5%. In absolute terms, the number of unemployed declined to ~3.5 crore in July from 4.1 crore in June.
Growth in passenger vehicle sales decelerates
Total passenger vehicle sales in India slipped 1.9% YoY to 296,785 units in July in stark contrast to a 5% growth in June, data from the Society of Indian Automobile Manufacturers (SIAM) revealed. However, SIAM believes growth to improve in the short term due to above-average rainfall and the upcoming festive season.

Global Update Roundups
Monetary policies
- The US Federal Reserve kept the federal funds rate unchanged at a 23-year high of 5.25%-5.50% for the eighth consecutive meeting. However, Federal Reserve Chairman Jerome Powell, at the Jackson Hole Economic Symposium, clearly indicated that the central bank will cut its interest rate in the September meeting if inflation aligns with expectations. Powell noted the cooling off job market and a downward revision to payrolls and expressed confidence in inflation nearing the central bank’s 2% target.
- The Bank of England cut its benchmark bank rate by 25 basis points to 5% after maintaining it at 16-year highs for a full year. The move aligned with market expectations. However, the bank intends to tread cautiously in loosening the monetary policy by closely monitoring the inflation trajectory.
- The People’s Bank of China left its key lending rates – 1-year (the benchmark for business and household loans) and 5-year Loan Prime Rates (mortgages) unchanged at 3.35% and 3.85%, respectively, after cutting them to new record lows in July. The move reflects China’s ongoing efforts to boost its economy and achieve the target growth of 5% in 2024.
GDP growth
- Japan: The GDP rose 0.8% QoQ in Apr-Jun 2024 in sharp contrast to a decline of 0.6% in the first quarter of the calendar year, as per preliminary reading. It was the strongest quarterly growth since the first quarter of 2023 led by a rise in private consumption (accounts for more than half of the economy) for the first time in five quarters (1.0% vs. -0.6% in Q1CY23)
- China: The growth in the Chinese economy decelerated to 4.7% YoY in Q2CY24 from 5.3% growth in Q1CY24, missing the consensus of a 5.1% growth. The sluggish growth is attributed to a continued weakness in the country’s real estate market, sluggish domestic demand, falling currency, and trade frictions with the West.
Unemployment data
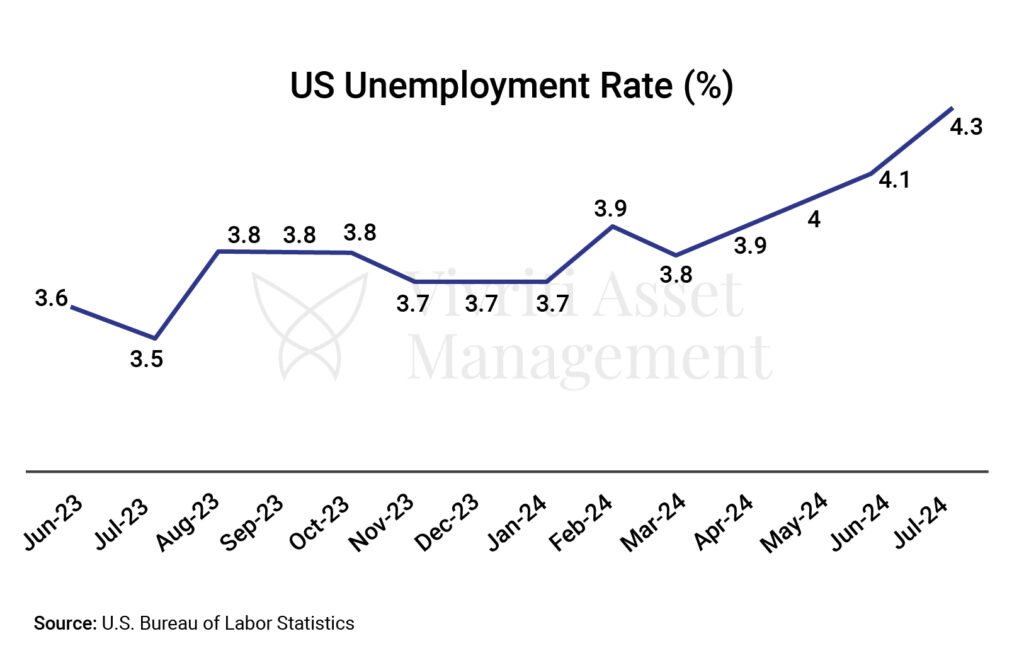
- US: The unemployment rate rose to 4.3% in July, the highest level since October 2021, from 4.1% in June, adding to concerns of a broader downturn. In July, the US added 114,000 jobs, which is down from 206,000 in June falling short of expectations.
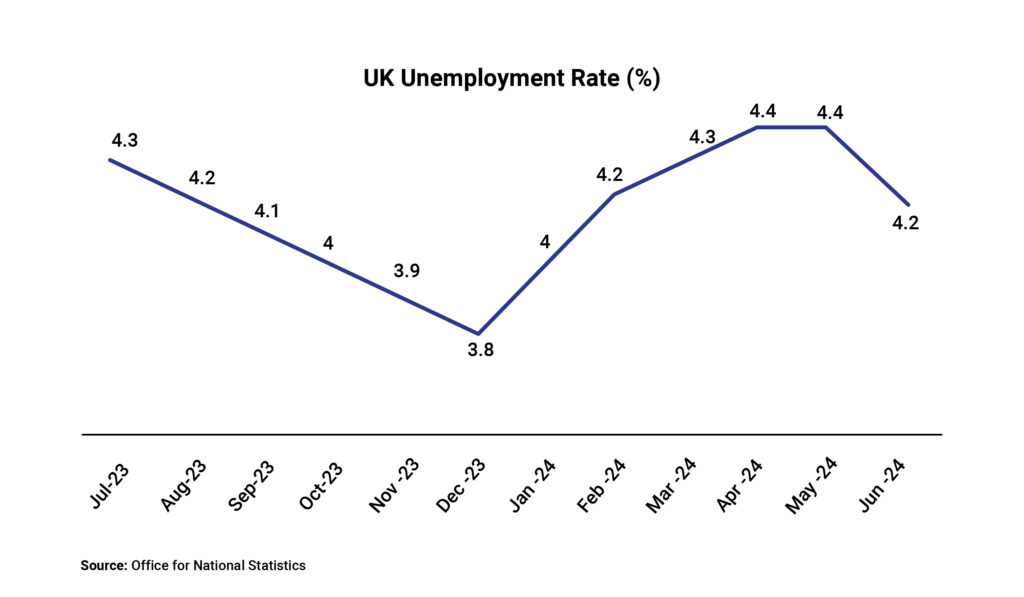
- UK: The unemployment rate declined to 4.2% in Jun 2024 from 4.4% in May, which was a two-and-a-half-year high. It came in below market forecasts of 4.5%. In absolute terms, the number of unemployed decreased by 51,000 to 1.44 million due to a fall in a number of people unemployed for up to 6 months.
- Canada: The unemployment rate remained unchanged at the 30-month high of 6.4% in July and came in below expectations of 6.5%. The Canadian economy lost 2,800 jobs in the month. The increase in full-time workers was offset by losses in part-time jobs. The labour participation rate in Canada dipped to a 26-year low of 65% in July (sans the pandemic year).
Inflation readings
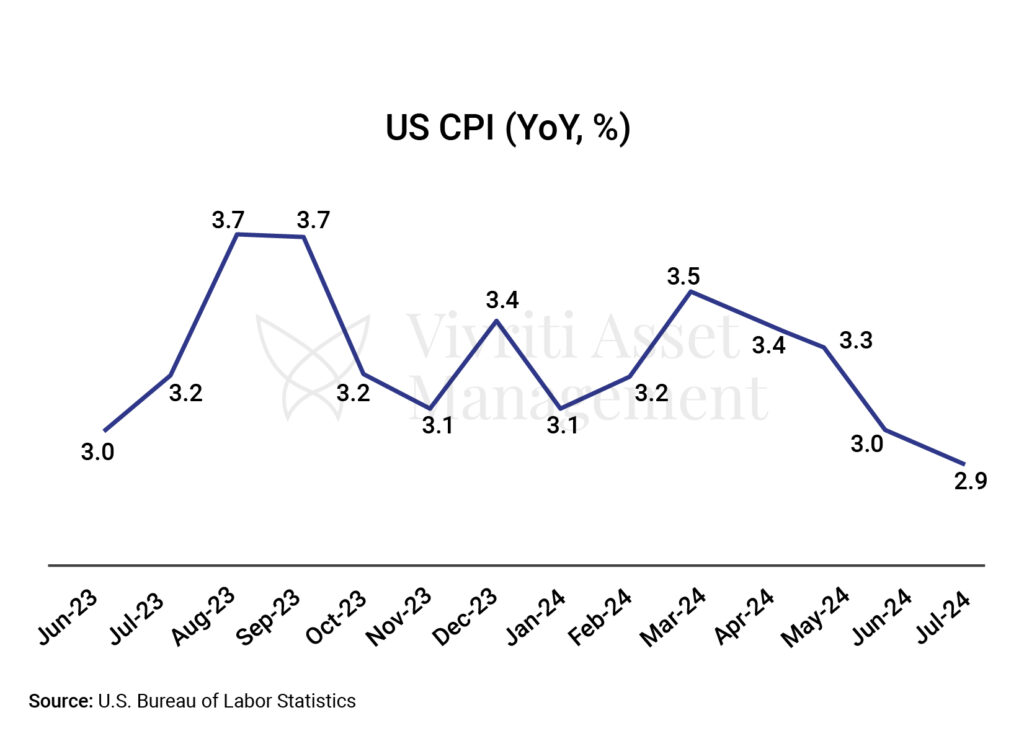
- US: Consumer price inflation in the US decelerated for a 4th consecutive month to 2.9% in July, the lowest reading since March 2021, from 3% in June. The reading is below the consensus of 3%. Prices for essentials, meat, poultry, fish, and milk recorded a marginal rise. Meanwhile, categories like used cars, airfares, and gasoline are getting cheaper.
- Eurozone: The annual inflation rate rose to 2.6% in July from 2.5% in June. It was above initial market expectations of 2.4%. Countries with the highest annual inflation rates included Romania, Belgium, and Hungary and those with the lowest rates included Finland, Latvia, and Denmark.
- China: The annual inflation rate rose to 0.5% in July from 0.2% in June, surpassing market expectations of 0.3%. It was the highest inflation reading since February. Food inflation was flat compared to a deflation of 2.1% in June while non-food prices continued to rise driven by clothing, housing, health, and education.
- Japan: The annual inflation rate held steady at 2.8% for the third straight month in July and remained at its highest level since February. It’s driven by elevated prices of electricity (rose the most since March 1981 at 22.3% vs. 13.4% in June), gas (7.4% vs. 2.4%), food (2.9% vs. 3.6%), housing (0.6% vs. 0.6%), transport (1.2% vs. 2.5%), furniture & household utensils (3.7% vs. 3.7%), clothes (2.2% vs. 2.2%), healthcare (1.5% vs 1.4%), and culture (4.4% vs. 5.6%).
- UK: The annual inflation rate edged up to 2.2% in July after remaining steady at 2% for consecutive two months earlier, which is also the central bank target. However, it came in below the consensus estimates of 2.3%. Categories that recorded faster price increases include housing and household services (3.7% vs 2.3%), clothing and footwear (2.1% vs 1.6%), communication (4.5% vs 2.9%), and miscellaneous goods and services (3.5% vs 2.9%).
Consumer confidence
- US: Consumer confidence rose to a six-month high of 103.3 in August from an upwardly revised 101.9 in July reflecting improved perceptions of business conditions. However, the citizens are concerned about the labour market after the unemployment reading jumped in July.
- Japan: Consumer confidence index remained steady at 7 in July compared with a month-ago reading but came in below the consensus of 36.9. Households’ sentiment in the country improved while the sentiment for income growth and employment deteriorated.
- UK: Consumer Confidence indicator remained steady at -13 in August for consecutive two months and defied expectations of a minor improvement to -12 due to concerns about the economy. However, the indicator reading remains at the highest level since September 2021.
Balance of Trade
- US: The US recorded a trade deficit that narrowed to US$73.1 billion in June from the revised US$75 billion in May, which is a 20-month high. Exports increased 1.5% to US$266 billion driven by higher sales of civilian aircraft, automotive vehicles, and energy commodities, including natural gas, petroleum products, and fuel oil.
- China: China recorded witnessed a trade surplus that widened to US$84.65 billion in July from US$80.22 billion in July 2023 but came in below the consensus estimates of US$99 billion. Exports increased 7% YoY while imports rose 7.2%, reversing from a 2.3% fall in the previous month and depicting the strongest growth since April.
- Japan: Japan recorded a trade deficit that expanded to JPY 621.84 billion in July from JPY 61.33 billion in July 2023, missing market expectations of a shortfall of JPY 330.7 billion. Imports increased 16.6% YoY, the highest since January 2023, to a 19-month high while exports rose for the eighth straight month by 10.3%.
Purchasing Manager’s Index
Monthly Data Snapshot
Disclaimer:
The details mentioned above are for information purposes only. The information provided is the basis of our understanding of the applicable laws and is not legal, tax, financial advice, or opinion and the same subject to change from time to time without intimation to the reader. The reader should independently seek advice from their lawyers/tax advisors in this regard. All liability with respect to actions taken or not taken based on the contents of this site are hereby expressly disclaimed.


